And while the topic of uncertainty is being extensively studied, the visualization and analysis of uncertainty remain grand challenges. In particular, methods for visualizing the behavior of uncertain time-varying flow fields have not been well developed.
To address this situation, researchers at Argonne National Laboratory and Ohio State University have extended a standard tool – finite-time Lyapunov exponents, or FTLE – to accommodate uncertainty.
“Our aim is to enable climate scientists to quantify the uncertainty of both convergent and divergent transport behavior between neighboring particles in a flow. This information can help understand the uncertainty of key features such as eddies and flow segmentation in simulations of atmospheric and oceanic processes,” said Hanqi Guo, a postdoctoral appointee in Argonne’s Mathematics and Computer Science Division.
One approach for visualizing uncertain flow involves using vector field topology methods, but these are limited to steady-state data. In other cases scientists use glyphs, or icons, to encode uncertainty information through attributes such as shape and size. However, such methods are usually limited to two-dimensional or small three-dimensional datasets and are not feasible for complex, 3D time-varying datasets characteristic of large atmospheric simulations.
Instead, the Argonne–Ohio State team turned to FTLE-based visualization. The team formulated a probabilistic framework for FTLE computation that involves two new concepts. First, the researchers derive what they call U-FTLE, a statistical representation (e.g., using the mean or standard deviation) of FTLE values in uncertain unsteady flows. The ridges of FTLE fields are used to derive what is called a U-LCS field – uncertain Lagrangian coherent structures indicating the boundaries between attracting or repelling particles in a flow. Ridges segmenting the flow field can then be extracted with density estimation algorithms.
The terminology may seem confusing, admitted Guo, but he emphasized that the concepts are important and complementary. Indeed, results from tests with real-world datasets show that the combination of U-FTLE and U-LCS can provide new insights into transport behaviors.
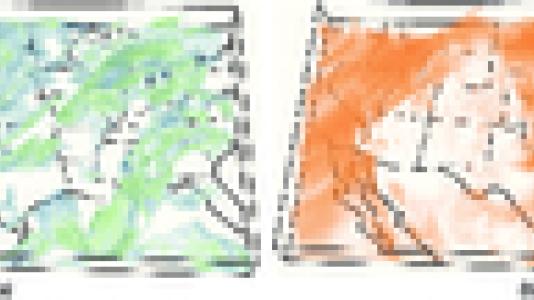
For example, in one experiment with data from Hurricane Isabel, the researchers showed that U-FTLE captures details between the hurricane eye and wall more authentically than do conventional methods, which often drop steps for further analysis in order to alleviate the high storage cost in scientific simulations. In another experiment involving a Weather Research and Forecasting model, the researchers generated an ensemble (Fig. 1) from several forecasts of the same point in time and modeled the uncertainty of the wind field using U-LCS and U-FTLE. The visualizations revealed that most of the uncertainty occurred in areas of steep vertical convection.
“The techniques give a quantitative and mathematically robust way to show three-dimensional uncertain flow in an manner that can highlight important structures in that atmosphere for researchers” said Scott Collis, an atmospheric scientist in Argonne’s Environmental Science division. And while the examples cited feature weather applications, Collis and his colleagues believe that the techniques can be applied to ensembles of high-resolution climate models to show uncertainty in features of the general circulation and the errors caused by temporal and spatial sampling.
For further information, see the paper by H. Guo, W. He, T. Peterka, H-W Shen, S. M. Collis, and J. J. Helmus, “FTLE and LCS in uncertain unsteady flows,” IEEE Transactions of Visualization and Computer Graphics, 22, no. 6 (2016) 1672-1682.