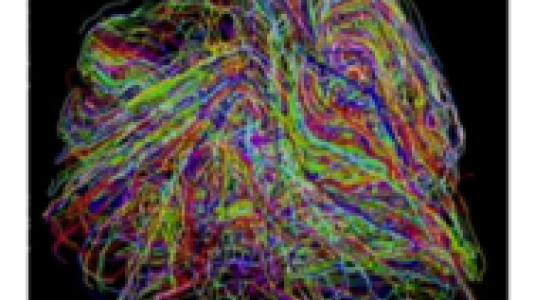
Flow visualization has long been an area of research, but the rapidly increasing size and complexity of flow field data have raised many new challenges.
To address these challenges, Tom Peterka, an assistant computer scientist in Argonne’s Mathematics and Computer Science Division, and his colleagues from four universities, presented a half-day tutorial October 13 at IEEE VIS 2013 — the premier forum for advances in scientific and information visualization.
The tutorial, “State-of-the-Art Flow Field Analysis and Visualization,“ ‘ covered five topics:
- Streamlines in 3D: techniques beyond seed placement,
- Texture-based flow visualization,
- Graph-based analysis of large-scale flow fields,
- Foundations of data-parallel particle advection, and
- Vector field topology in flow analysis and visualization.
The goal was to introduce visualization researchers and practitioners to the latest technologies available for analyzing and visualizing large-scale flow field data sets.