EVS has developed extensive geospatial libraries of energy and environmental data to support our work, partnered with a multidisciplinary team of scientists and engineers to analyze impacts of potential projects and programs, created models to simulate energy and environmental processes, and produced web-based and desktop tools to help stakeholders understand issues and participate in decision making.
The geographic context of energy and environmental issues is so fundamental to decision making that many of our projects routinely involve geospatial data, tools, analysis, modeling, and visualization. EVS libraries of geospatial information, which are actively maintained to support a diverse mix of projects, can be accessed rapidly and shared both internally and externally. EVS has more than 7 staff members primarily trained in geographic information system (GIS) and remote sensing, and many others have significant skills in these disciplines. In addition to traditional GIS activities such as cartography and data processing, we perform advanced analysis and modeling (such as individual-based models of trout in stream ecosystems), along with modeling to determine suitable locations for energy zones. An excellent web-development team extends our capabilities to design, create, and host convenient web-based mapping tools providing geospatial visualization and tools to large and diverse audiences.
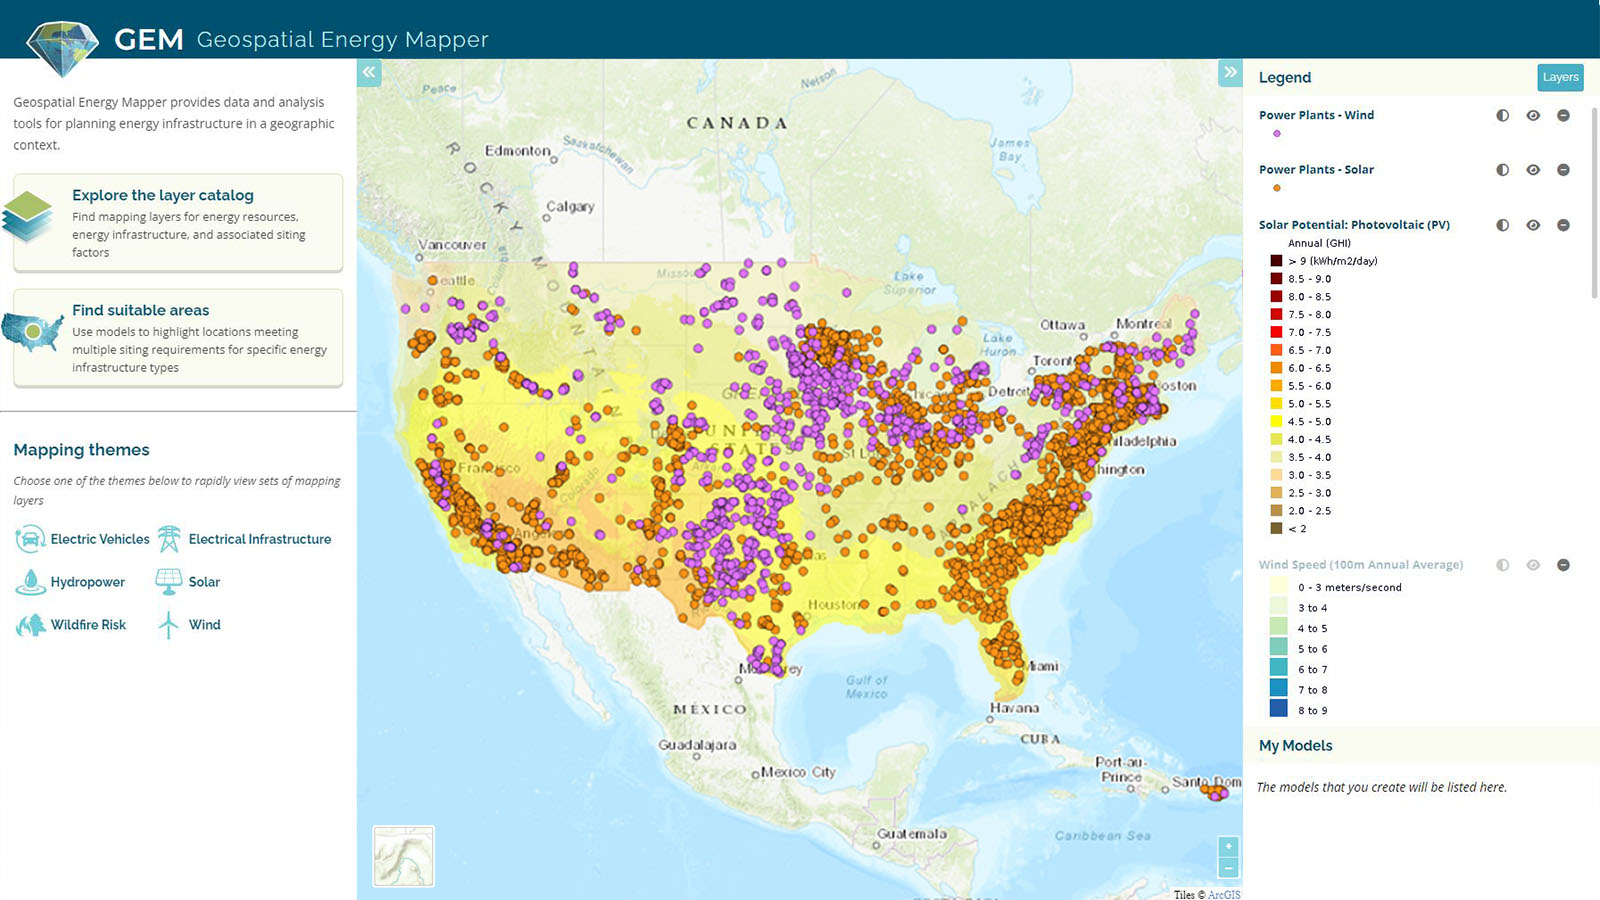
One current project is the Geospatial Energy Mapper (GEM), an updated version of the Energy Zones Mapping Tool (EZMT). GEM is a comprehensive online mapping tool that spans nine different clean energy resources: biomass, coal with carbon sequestration, geothermal, natural gas, nuclear, solar, storage, water, and wind. It includes a library of over 190 different mapping layers, 100 modeling criteria, and has models for mapping suitability of 40 types of energy infrastructure.
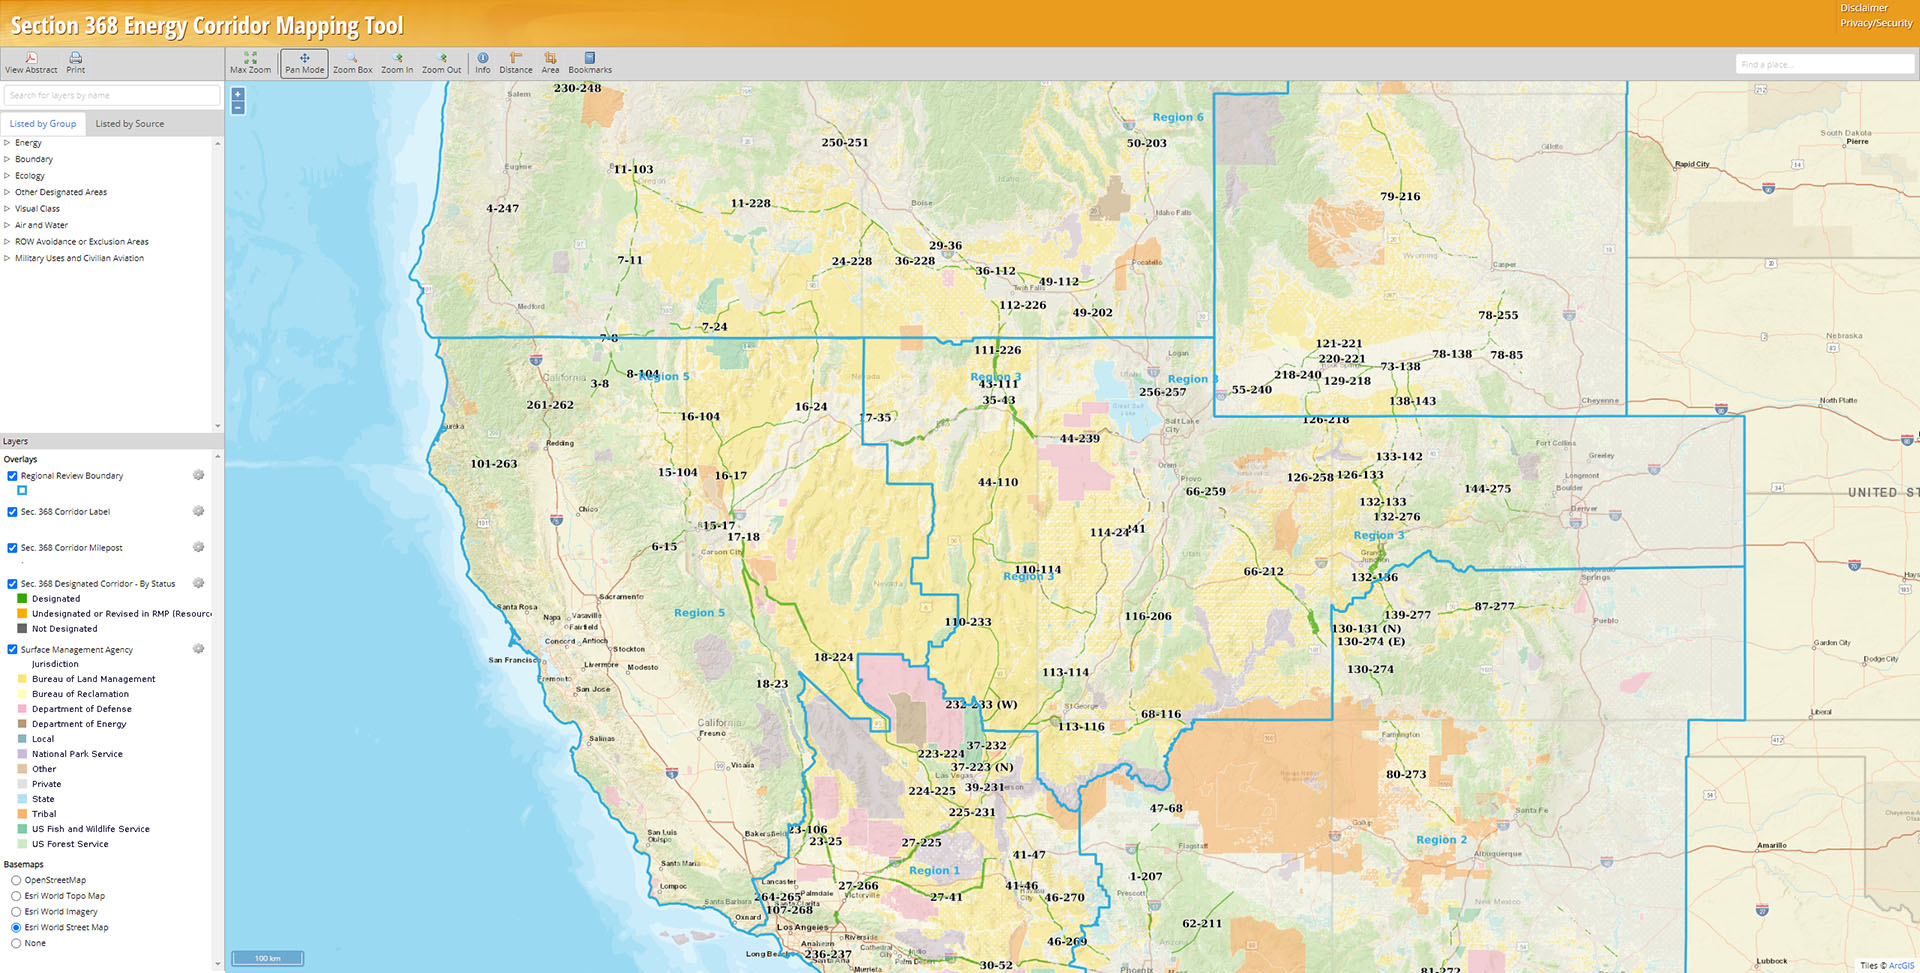
The Section 368 Energy Corridor Mapping Tool helps the user learn more about these energy corridors in the western United States, by:
Additional Section 368 Energy Corridor resources are available on the West-wide Energy Corridor Information Center website.
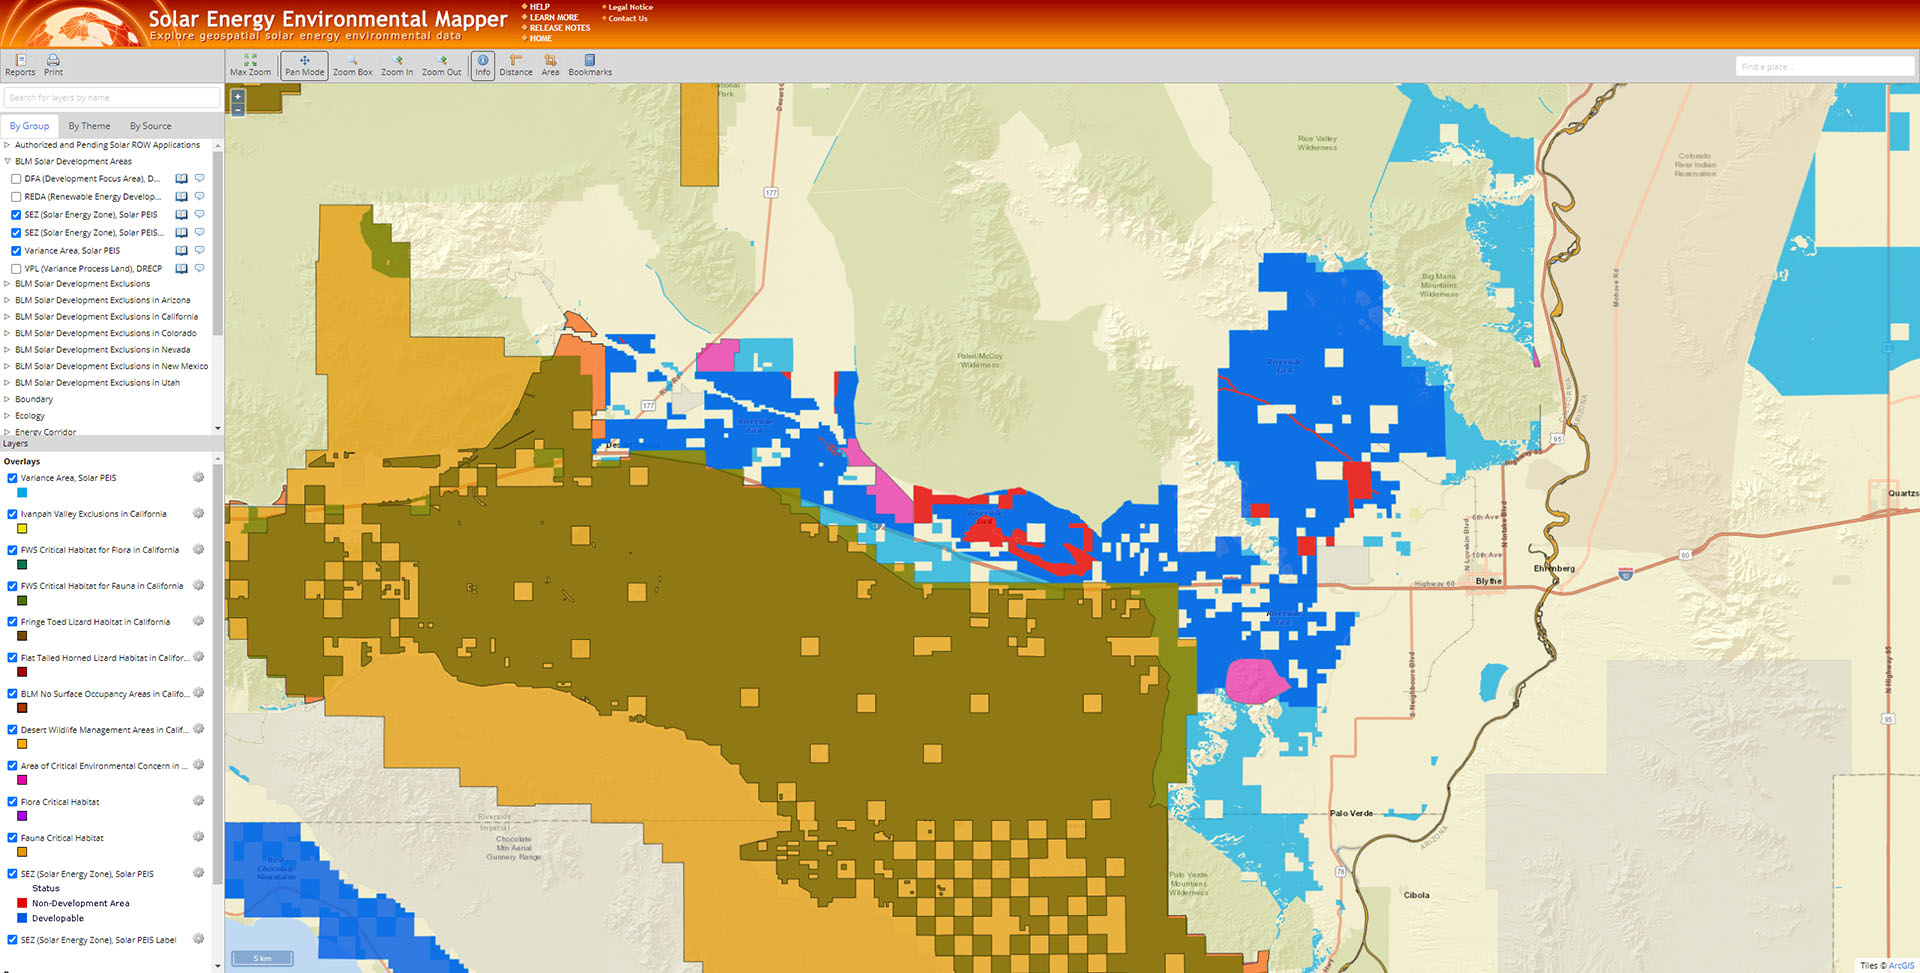
The Solar Energy Environmental Mapper is an interactive, web-based mapping tool to display environmental data for the southwestern United States in the context of utility-scale solar energy development. This tool provides access to screening-level data concerning resources and constraints, as well as analysis tools to help improve siting decisions.
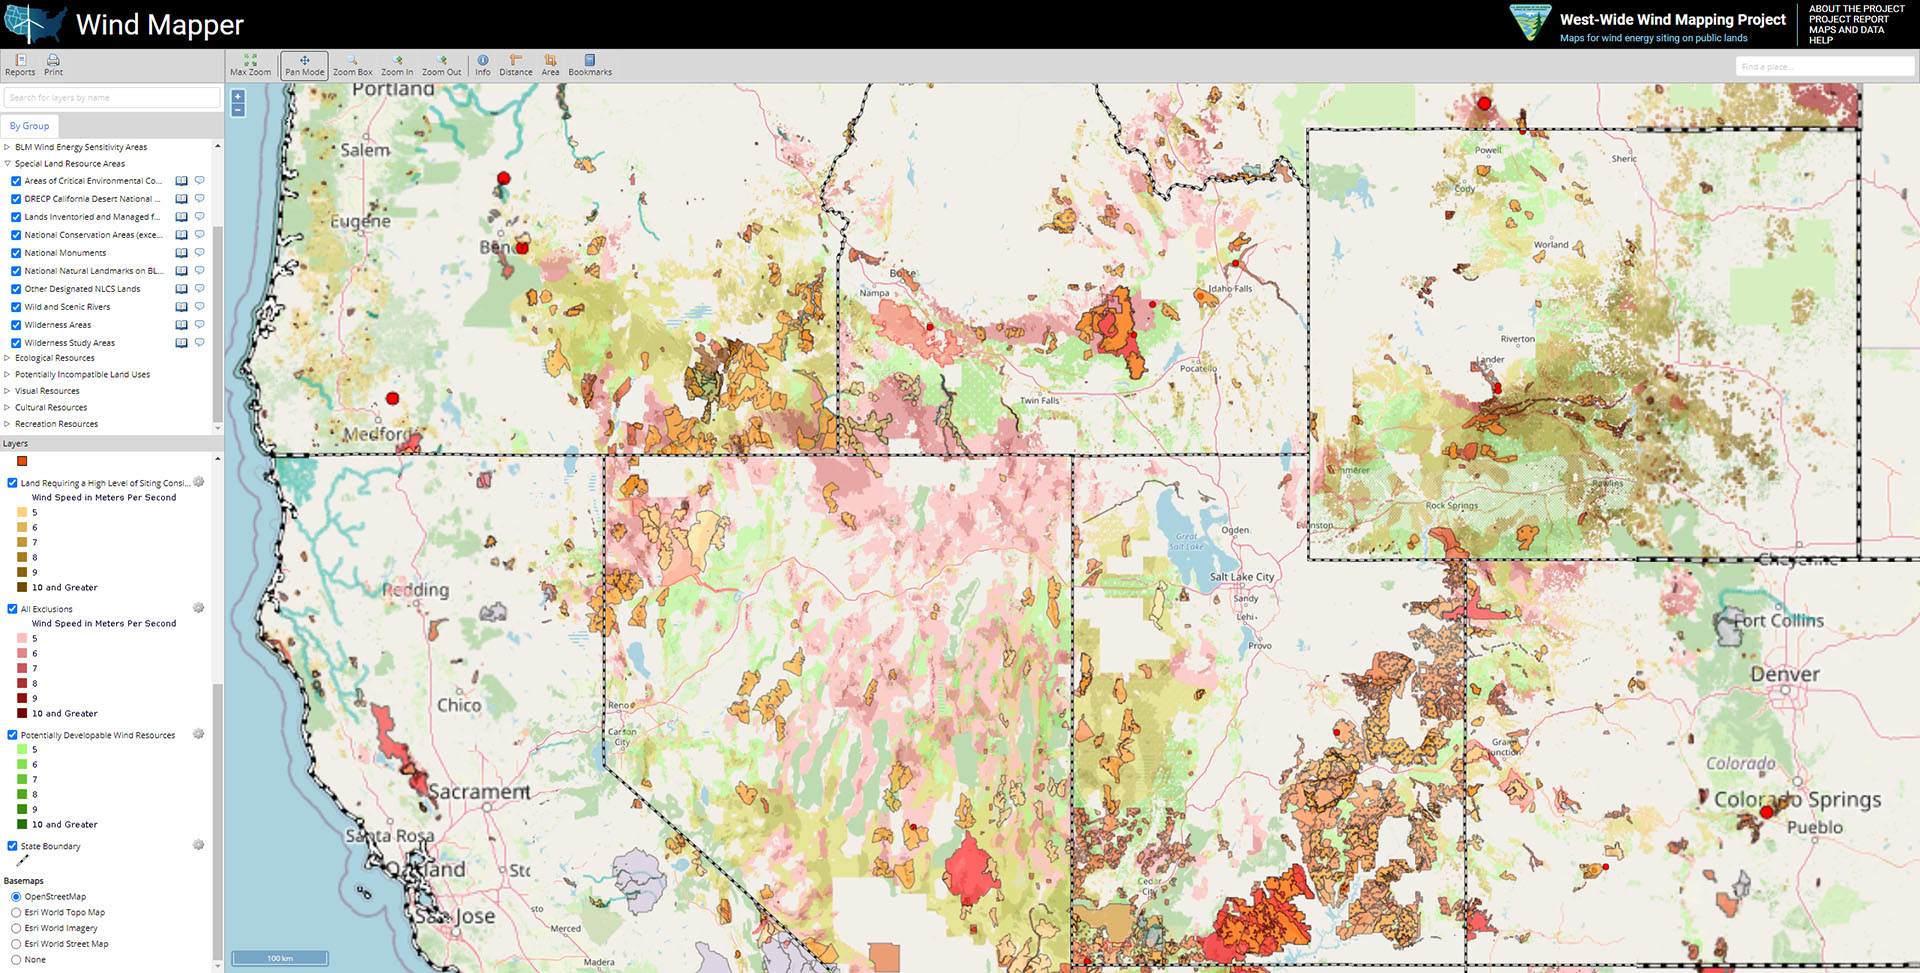
The West-Wide Wind Mapping Project includes an interactive mapping tool for public lands in the western United States, data on wind resource potential and many siting factors, and a set of dynamically generated reports that summarize six categories of wind energy development exclusions and resource sensitivities for user-specified areas. The project report, maps, and data are also available at the site.