Research reports are a way to communicate the story of your experiment. You want to explain why the experiment was done, how it was done, the results, interpretation of the results, and why the experiment matters.
The reports have a particular style so that information is presented in a very clear, concise, and logical manner. It is very important that you follow the SULI or CCI guidelines for your report (see appropriate sections of the Communicating Science webpage). The information below highlights details of how to appropriately prepare each section.
All included items should be as brief as possible – word limits are usually around 300-500 words. SULI guidelines are 500 words. The following components are important:
To put the research into perspective and provide rationale for the experiments, the following components should be included:
This is not intended to be a laboratory manual, so “cookbook” type of material is not necessary. However, enough information should be provided so that a reasonably competent person could replicate the study by reading the description and doing a small amount of further checking. The following should be included:
All experimental data including charts, graphs, tables, photographs, etc should be put in this section. All charts, etc. should be referred to and explained in the text. Do not include any interpretation of data. The purpose of this section is to show the data in such a way that the reader can interpret it for him/herself. When formatting this section, there are some important things to keep in mind.
1. Significant Digits: Pay attention to how many digits you use when reporting numerical data, particularly after a calculation. It is not desirable or accurate to report all the digits just because your calculator or Excel reports them. Report only as many digits as accurately measured by the instrument used. After a calculation (for example, a mean calculation) it is acceptable to report one additional digit. Do not report any more digits than is acceptable. Doing so would suggest more accuracy than was actually measured.
2. Describing Data: Make every effort to be precise in your descriptions – do not use ambiguous words. When statistical analysis is done, be careful in how it is used. If two data sets are not significantly different from each other, then they are the same even if the numerical values are different.
3. Figures: Label all pictures and graphs as “Figure” and number sequentially. Place the label below the figure and include a descriptive title for the figure. Additional information can be included in the figure legend for a clearer understanding the figure. DO NOT place excessive descriptions in the legend.
4. Tables: Label as “Table’ and number sequentially. Place the label above the table with a title for the table. Place clarifying information below the table.
5. Data Labeling: Make sure that words are used to identify experimental groups, tubes, etc on all figures and tables. DO NOT LABEL SIMPLY AS “TUBE 1” OR “GROUP 1” etc.
It is very important that data is described in two places – both in the written text and in the figures and tables.
6. Text vs. Figures/Tables: Do not simply place charts, graphs, etc in the results section without explanation. ALL data should be described in written form. If data is placed in a table or figure it MUST ALSO BE found in the text of the document. The text description of the data should specifically refer to the figure or table containing the data. See specific examples for how that is done below.
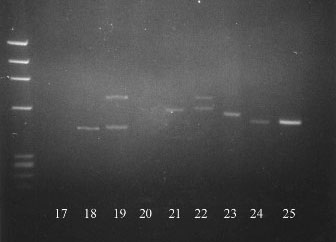
For the figures, note the figure legend and the text description below the legend.
As shown in Figure 1, students 19 and 22 were heterozygous for D1S80 alleles while students 18, 21, 23, 24 and 25 were homozygous. Amplification of the D1S80 region in students 17 and 20 failed.
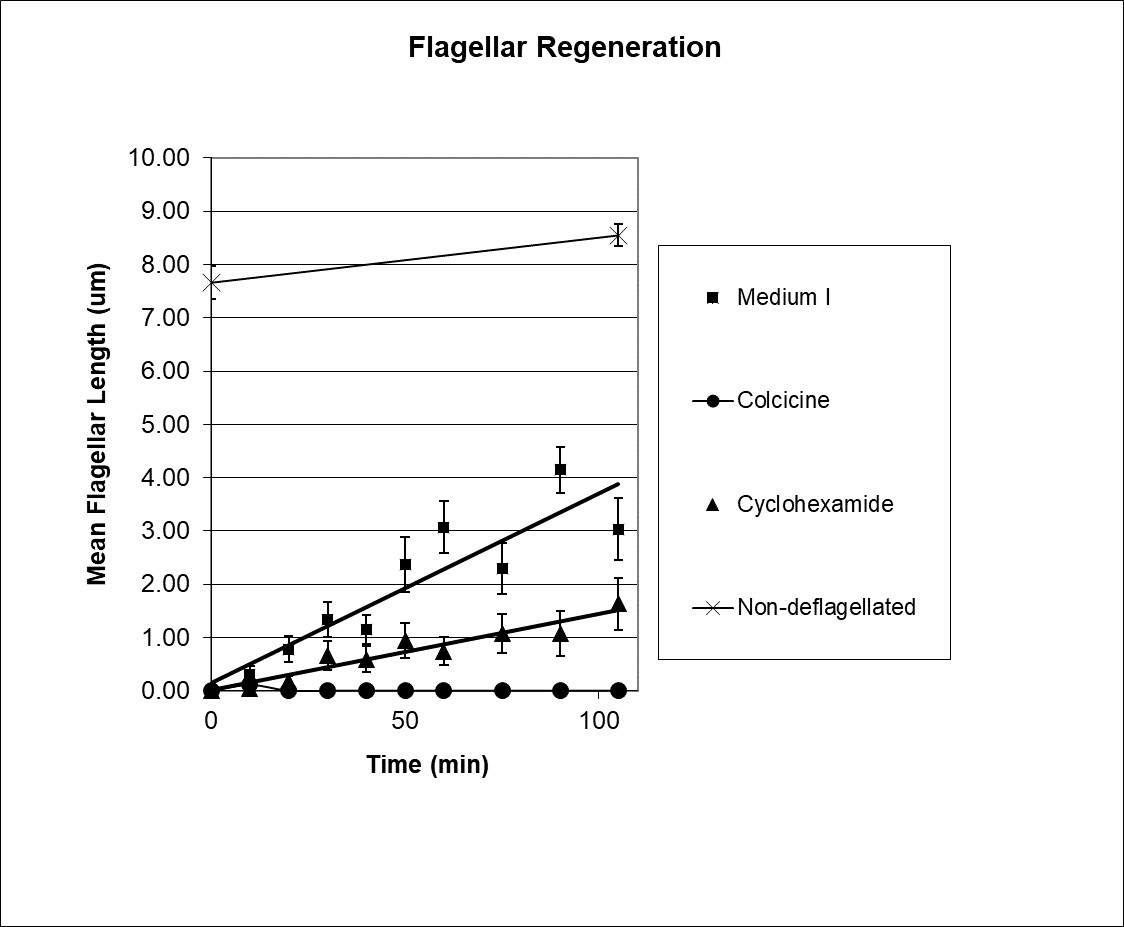
Flagella re-grew after deflagellation in untreated (medium I) cultures to approximately 50% of total length after 100 minutes. This re-growth was slowed in both the cyclohexamide and colchicine treated cultures with colchicine treated cultures showing no growth at all (Figure 2).
For the table, note the title at the top, descriptive information on the bottom, and the text description of the data.
Table 1: Normalized Relative Expression of mRNA for Paracrine Factors
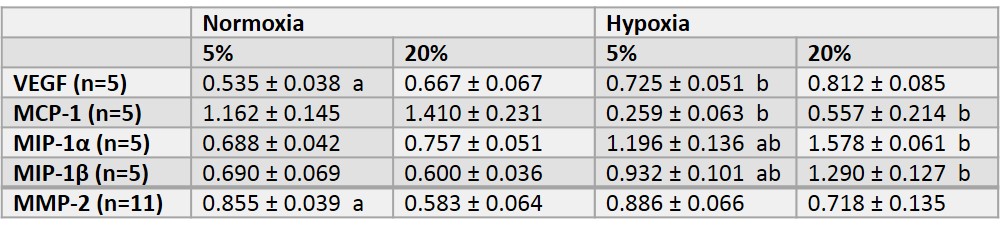
The normalized relative expression of mRNA in mesenchymal stem cells for the various paracrine factors was determined using RT-qPCR (Table 1). Serum reduction to 5% caused a significant drop in the relative expression of VEGF mRNA compared to 20% in normoxic (p<0.05) but not in hypoxic conditions. Hypoxia resulted in a significant elevation of VEGF expression levels for cells grown in 5% serum (p<0.05%) but not in 20%. Expression of MCP-1…
This section should draw conclusions from the data presented and put it into a larger perspective in terms of how these fits in with other research that has been done. The following should be included:
All material obtained from outside sources should be properly referenced in the text. The method used for this varies depending on where the paper is published. The following are SULI guidelines for research reports which requires the use of the American Institute of Physics (AIP) Style Manual, 4th edition. The examples are taken from the SULI guide. More detailed instructions can be found in the guidelines (pages 8-10 of the SULI guidelines and page 9 of the AIP Style Manual).